If you are interested in gas chromatography but don’t know much about it, this article will introduce you to gas chromatography in detail.
1. What is gas chromatography?
Gas chromatography, abbreviated as GC, is an analytical method for qualitatively and quantitatively analyzing the components of a mixture. It uses a gas as the mobile phase and a solid or liquid as the stationary phase to complete the separation process of compounds. A gas chromatogram is divided into a horizontal axis and a vertical axis. The horizontal axis is the retention time, used for qualitative analysis to determine what substances are present. The vertical axis is the peak height/peak area, used for quantitative analysis.
2. Type of gas chromatography
2.1 Based on the different stationary phases
It can be divided into gas-solid chromatography and gas-liquid chromatography. Both share the characteristic that the mobile phase is a gas, and the stationary phase is a solid or a liquid, respectively.
2.2 Based on the type of chromatographic column。
Gas chromatography can be divided into packed column gas chromatography (GC) and capillary column gas chromatography (GC).
2.3 Based on the different separation principles
Gas chromatography can be divided into partition chromatography and adsorption chromatography.
3. History of Gas Chromatography
The development of GC chromatography is inseparable from the development of two aspects: the development of gas chromatography separation technology and the development of other disciplines and technologies.
In 1941, Martin and Synge proposed the possibility of using gas as the mobile phase.
In 1952, James and Martin proposed gas-liquid chromatography and also invented the first gas chromatograph detector. The first gas chromatograph was invented in 1955. In 1956, Van Deemter et al. developed the rate theory. From then until 1957, it was the era of packed columns and TCDs. In 1958, Gloay first proposed the capillary tube. In the same year, Mcwillian and Harley invented the FID (Fixed Induction Detector), and Lovelock invented the Argon Ionization Detector (AID), improving the sensitivity of detection methods by two to three orders of magnitude.
In the 1960s and 70s, gas chromatography-mass spectrometry (GC-MS) developed. In 1966, Brody et al. invented the FPD (Fixed Induction Detector); in 1974, Kolb and Bischoff proposed the electrically heated NPD; and in 1976, HNU Corporation in the United States introduced the practical window-type photoionization detector (PID), etc.
In the 1980s, due to the rapid and widespread application of flexible quartz capillary columns, there were demands for detectors with small size, fast response, high sensitivity, and good selectivity. In particular, the development of computers and software greatly improved the sensitivity and stability of TCD, FID, ECD, and NPD, while significantly reducing the cell volume of TCD and ECD.
In the 1990s, the rapid development of electronic technology, computers, and software led to a decrease in the production cost and complexity of the MSD (Medium-to-Density Detector), while increasing its stability and durability, making it one of the most widely used gas chromatography detectors. During this period, non-radioactive pulsed discharge electron capture detectors (PDECD), pulsed discharge helium ionization detectors (PDHID), and pulsed discharge photoionization detectors (PDECD), as well as pulsed discharge detectors (PDD) integrating these three technologies, emerged. Four years later, Varian Instruments in the United States launched a commercial instrument that was 100 times more sensitive than the typical FPD. Furthermore, the rapid development of rapid separation technologies such as fast GC and full two-dimensional GC spurred the gradual maturation of rapid GC detection methods.
Although GC appeared 50 years later than LC, its development over the following 20 years far surpassed that of LC. From the introduction of the first commercial GC instrument in 1955 to the advent of the capillary GC column in 1958; from the theoretical research of capillary GC to the application of various detection techniques, GC quickly transformed from a laboratory research technique into a routine analytical method, almost establishing GC’s dominance in the field of chromatography. Since 1970, the development of electronic technology, especially computer technology, has greatly enhanced GC chromatography. The advent of the flexible quartz capillary column in 1979 further propelled GC to a new level. These advancements are both a result of high-tech development and a necessity driven by the demands of modern industrial and agricultural production. Conversely, chromatography technology has greatly promoted the development of modern material civilization. It plays a vital role in all aspects of modern society. From space shuttles to aircraft carriers, GC is used to monitor gas quality in ship compartments; from food and cosmetics in daily life to process control and product quality inspection in various chemical production processes; from substance identification in forensic examinations to oil and gas field exploration in geological surveys; from disease diagnosis and pharmaceutical analysis to archaeological excavation and environmental protection, the applications of GC technology are extremely wide-ranging.
4. How Does Gas Chromatography Work?
The mobile phase in gas chromatography is an inert gas, while in gas-solid chromatography, an adsorbent with a large surface area and certain activity is used as the stationary phase. When a multi-component mixed sample enters the chromatographic column, due to the different adsorption forces of the adsorbent on each component, the speeds of each component in the column will differ after a certain period of time. Components with weaker adsorption forces are more easily desorbed and leave the column first, entering the detector, while components with the strongest adsorption forces are least likely to be desorbed and therefore leave the column last. In this way, the components are separated from each other in the chromatographic column and sequentially enter the detector for detection and recording.
To understand how gas chromatography separates compounds, let’s use a simple analogy.
If we compare the entire chromatographic separation process to a marathon, the injection port is the starting line, the chromatographic column is the track, and the detector is the finish line referee. The carrier gas, or mobile phase, is the wind, and the stationary phase is the racecourse. Driven by the carrier gas, the compounds begin to run along the track. Because the properties of each compound are different, some run faster and some slower, and they begin to separate. This process of creating distance achieves fractional separation.
5. Application of Gas Chromatography
In the petrochemical industry, most raw materials and products can be analyzed using gas chromatography. For example, it can be used for oil analysis, aromatic hydrocarbon analysis, and analysis of sulfur- and nitrogen-containing compounds.
In the power sector, it can be used to check for latent faults in transformers.
In environmental protection, it can be used to monitor urban air and water quality; for example, analyzing toxic gases in the atmosphere, pesticide residues in water, and soil pollution.
In agriculture, it can be used to monitor pesticide residues in crops.
In the commercial sector, it can be used to inspect and assess food quality; for example, whether additives are illegal or exceed microbial limits.
In medicine, it can be used to study human metabolism and physiological functions; common applications include measuring hormones, estriol, progesterone, and ethanol in the blood.
Clinically, it is used to identify drug poisoning or disease types; it can detect heavy metals and volatile drug residues in the human body.
In spacecraft, it can be used to automatically monitor gases within the sealed compartments, etc.
6. Composition of a Gas Chromatograph (GC)
It consists of five main systems: gas path system, sample injection system, column system, detection and recording system, and control system.
6.1 Gas Path System
Primarily provides pure, stable-flow carrier gas.
It comprises the following components:
6.1.1 Gas cylinder or gas generator provides the carrier gas source.
The carrier gas selection criteria are: matching the analyte and the detector used; it should be chemically inert and not react with related substances, typically nitrogen, helium, hydrogen, or argon.
6.1.2 Pressure regulator;
6.1.3 Purification tubing:
Usually a series of color-changing silica gel, molecular sieves, and activated carbon tubes, used to remove water, oxygen, hydrocarbon gases, and other impurities.
6.1.4 Flow controller,
Including pressure regulating valve and flow regulating valve, controls the carrier gas pressure to be stable and the flow rate controllable.
6.2 Sample Injection System
Introduces the sample into the GC and performs effective purification.
6.3 Column System
The heart of the chromatograph, where the sample is separated on the column. It includes important components such as the chromatographic column, column oven, and heating system.
Common gas chromatography columns include packed columns and capillary columns. Compared to packed columns, capillary columns have a smaller capacity but higher efficiency.
6.4 Detection and Recording System
After separation, the components exiting the chromatographic column are detected by the detector and generate corresponding signals.
This system consists of a detector, amplifier, and data processing unit.
Function: A device that converts the analytes eluting from the chromatographic column into corresponding electrical signals based on their characteristics and concentrations.
6.5 Control System
Controls the operation of the entire instrument, including temperature control of the injector, column oven, and detector; injection control; carrier gas flow control (automatic injection control); and signal control.
Whether components can be separated depends on the chromatographic column; whether the separated components can be identified depends on the detector. Therefore, the separation system and detection system are the core of the instrument.
7. Common Detector Types for Gas Chromatographs
7.1 Thermal Conductivity Detector (TCD)
This is a universal detector that can detect almost all gases. However, its sensitivity is not high, and it is generally used to detect gases that are difficult to detect with other detectors.
Thermal Conductivity Detector (TCD): Also known as a thermal conductivity cell or hot wire detector, it is one of the most commonly used detectors in gas chromatography. It operates based on the principle that different components and carrier gases have different thermal conductivities.
Working Principle: The working principle of the thermal conductivity detector is based on the fact that different gases have different thermal conductivities. The hot wire has the characteristic that its resistance changes with temperature. When a constant direct current passes through the thermal conductivity cell, the hot wire is heated. Due to the thermal conduction of the carrier gas, some of the heat from the hot wire is carried away by the carrier gas, and some is transferred to the cell body. When the heat generated by the hot wire and the heat lost reach equilibrium, the temperature of the hot wire stabilizes at a certain value. At this time, the resistance of the hot wire also stabilizes at a certain value. Since both the reference cell and the measuring cell are filled with pure carrier gas, and the same carrier gas has the same thermal conductivity, the resistance values of the two arms are the same, the bridge is balanced, there is no signal output, and the recording system records a straight line. When a sample enters the detector, the pure carrier gas flows through the reference cell, and the carrier gas carries the component gas through the measuring cell. Because the thermal conductivity of the binary mixture of the carrier gas and the analyte is different from that of the pure carrier gas, the heat dissipation in the measuring cell changes, causing a difference in the resistance values of the hot wires in the reference cell and the measuring cell orifice. The bridge becomes unbalanced, the detector outputs a voltage signal, and the recorder plots the chromatographic peaks of the corresponding components. The higher the concentration of the analyte in the carrier gas, the more significant the change in the thermal conductivity of the gas in the measuring cell, and the more significant the changes in temperature and resistance, resulting in a stronger voltage signal. At this time, the output voltage signal is proportional to the concentration of the sample, which is the quantitative basis of the thermal conductivity detector [3]. The thermal conductivity detector (TCD) is a general-purpose non-destructive concentration detector and has always been one of the most widely used gas chromatography detectors in practical work. TCD is particularly suitable for the analysis of gas mixtures, and it shows unique advantages for the analysis of inorganic gases that cannot be directly detected by the flame ionization detector. TCD does not destroy the monitored components during the detection process, which is beneficial for sample collection or for use with other instruments. TCDs meet the peak-high quantification requirements of industrial analysis and are well-suited for control analysis in factories.
Common Carrier Gas Thermal Conductivity Table
| Carrier Gas | Thermal Conductivity |
| H2 | 224.3 |
| He | 75.6 |
| N2 | 31.5 |
| Air | 31.5 |
| Methane | 45.8 |
| Propane | 26.4 |
| Ethanol | 22.3 |
| Acetone | 17.6 |
Thermal conductivity is inversely proportional to molecular weight. The larger the molecular weight, the lower the thermal conductivity.
7.2 Hydrogen Flame Ionization Detector (FID)
Primarily detects organic compounds and is suitable for trace amounts of organic matter. It cannot detect inert gases, air, water, CO, CO2, NO, SO2, etc.
The hydrogen flame ionization detector (FID) is designed based on the fact that the conductivity of a gas is directly proportional to the concentration of charged ions in that gas. Normally, component vapors are non-conductive, but under the influence of energy, component vapors can be ionized to generate charged ions and become conductive.
Working Principle: When the carrier gas (sample) flowing from the chromatographic column passes through a hydrogen flame at a temperature as high as 2100℃, the analyte organic component undergoes ionization in the flame, resulting in a certain amount of positive and negative ions between the two electrodes. Under the influence of an electric field, the positive and negative ions are collected by their respective electrodes. When the carrier gas does not contain the analyte, the number of ions in the flame is very small, i.e., the baseline current is very small, about 10⁻¹⁴ A. When the analyte organic component passes through the detector, the number of ionized ions in the flame increases, and the current increases (but is very weak, 10⁻⁸ to 10⁻¹² A). A larger voltage signal needs to be obtained after passing through a high resistance (10⁸ to 10¹¹), and then amplified by an amplifier to display a sufficiently large chromatographic peak on the recorder. The magnitude of this current is proportional to the mass of the analyte entering the detector per unit time within a certain range; therefore, the flame ionization detector is a mass-type detector.
Flame ionization detectors respond to organic compounds with ionization potentials lower than H2, but are essentially unresponsive to inorganic compounds, persistent gases, and water. Therefore, flame ionization detectors can only analyze organic compounds (carbon-containing compounds) and are unsuitable for analyzing inert gases, air, water, CO, CO2, CS2, NO, SO2, and H2S.
Application Example: Determination of benzene series compounds in air.
7.3 Electron Capture Detector (ECD)
Application Example: Determination of chlorinated pesticide residues in food.
7.4 Flame Photometric Detector (FPD)
Also known as the “sulfur-phosphorus detector,” when an organophosphorus sample is burned in a hydrogen-rich flame in the detector, it emits characteristic light with wavelengths of 393 nm (sulfur) and 525 nm (phosphorus). This light is selected by a filter, received by a photomultiplier tube, converted into an electrical signal, amplified by a microcurrent amplifier, and recorded as a chromatographic peak.
Application Example: Determination of multiple residues of organophosphorus pesticides.
Mobile phase: Nitrogen flow rate: 50 mL/min
Stationary phase: Packed with a mixed stationary phase coated with 4.5% DC-200 + 25% OV-17
Detector: Flame photometric detector
Column temperature: 200°C; Vaporization temperature: 260°C; Detector temperature: 270°C
7.5 Mass spectrometry detector
Mass spectrometric detector (MSD, GC-MS) combines the advantages of gas chromatography (GC) in separating mixtures with the qualitative and quantitative advantages of mass spectrometry, allowing for separation before analysis. It is suitable for the qualitative and quantitative analysis of low-boiling-point mixtures. For compatibility with mass spectrometry, the carrier gas is typically He.
8 Gas Chromatography Injection Methods
8.1 Gas Chromatography Packed Columns
Headspace injection is a unique injection method in gas chromatography. It is suitable for the analysis of highly volatile components. For determination, accurately weigh 3-5 ml each of the standard solution and the test solution and place them separately in 8 ml headspace vials. Heat each vial in a 60°C water bath for 30-40 min to allow residual solvent to evaporate to saturation. Then, use a syringe heated in an empty test tube in the same water bath to draw an appropriate amount of headspace air (usually 1 ml). Inject the sample, repeating the injection three times. Calculations and processing are performed according to the direct solvent injection method.
Headspace sampling involves injecting the analyte after it has evaporated, eliminating the need for sample extraction and concentration. It also avoids contamination of column chromatography by non-volatile components of the sample, but requires the analyte to have sufficient volatility.
Headspace analysis determines the content of components in the original sample by analyzing the gaseous composition above the sample matrix. Its basic theoretical basis is the partition equilibrium between the gas phase and the condensed phase (liquid and solid phase) under certain conditions. Therefore, the composition of the gas phase reflects the composition of the condensed phase. Headspace analysis can be viewed as a gas-phase extraction method, using gas as a “solvent” to extract volatile components from the sample; thus, headspace analysis is an ideal sample purification method. Traditional liquid-liquid extraction and SPE dissolve the sample in a liquid, inevitably leading to interference from co-extractants. Furthermore, the purity of the solvent itself is also an issue, especially important in trace analysis. Using gas as a solvent avoids unnecessary interference because high-purity gases are readily available and inexpensive. This is one reason why headspace gas analysis is widely used.
As an analytical method, headspace analysis is simple, as it analyzes only the gaseous phase, greatly reducing potential interference or contamination from the sample itself. Headspace sampling can relatively reduce the amount of high-boiling-point solvents used to dissolve the sample, shortening the analysis time. However, it requires high solvent purity, especially avoiding low-boiling-point impurities, which can severely interfere with the determination. Finally, combined with the quantitative analysis capabilities of GC, headspace GC can perform accurate quantitative analysis.
8.2 Process Headspace GC typically involves three processes
sampling, injection, and GC analysis.
8.3 Classification
Depending on the sampling and injection methods, headspace analysis can be divided into dynamic and static methods. Static headspace analysis involves sealing the sample in a container and allowing it to reach gas-liquid equilibrium at a certain temperature for a period of time. Then, the gaseous phase is sampled and introduced into the GC for analysis. Therefore, static headspace GC is also called equilibrium headspace GC or single-phase gas extraction. If a second sample is taken, the results will differ from the first sample analysis because the sample composition has changed after the first sampling. In contrast, continuous gas extraction involves multiple sampling until all volatile components are extracted from the sample. This is known as dynamic headspace GC. A common method is to continuously pass an inert gas, such as helium, through the sample. The volatile components escape from the sample with the extraction gas, then are concentrated using an adsorption device (trapper), and finally the sample is desorbed and analyzed by the GC. This method is often called purge-trap analysis.
9. How to interpret gas chromatography?
Many factors can interfere with gas chromatography results, the most common being:
Dirty containers, contaminated sample.
Low solvent purity, containing other impurities.
Carrier gas reacts chemically with the sample at high temperatures, forming other compounds.
Carrier gas flow rate is too fast or too slow, uncontrollable.
Insufficient carrier gas purity, containing other gases.
Aging and malfunctioning column.
Abnormal temperature control of the detector.
10. How to read gas chromatography graphs or results?
A chromatogram consists of an X-axis and a Y-axis. The X-axis shows the time required for the analyte to pass through the chromatographic column and reach the mass spectrometer detector, also known as the peak retention time. Each peak on the chromatogram represents an individual compound. The number of peaks indicates the number of compounds in the sample being analyzed. This is then compared with the standard chromatogram and retention time provided on the reference material certificate. If they match, the peak is identified as the corresponding substance, a process called qualitative analysis.
The Y-axis reflects peak height and peak area. Peak height reflects the concentration of a component at a given moment, while peak area represents the total amount of the component. By measuring peak height or peak area, the relative content of each component in the sample can be calculated, a process called quantitative analysis.
Interpretation Steps
**Peak Identification:** First, identify all peaks on the chromatogram and record their retention times.
**Standard Comparison:** Compare the chromatogram of the unknown sample with the chromatogram of a known standard. Matching retention times helps to preliminarily identify the components in the sample.
**Quantitative Analysis:** By measuring peak height or peak area and combining this with the concentration information of the standard, the content of each component in the sample can be calculated.
Evaluate separation effectiveness: Observe the degree of separation between peaks on the chromatogram to evaluate the separation effect of the chromatographic column. If there is severe overlap between peaks, it may be necessary to adjust the chromatographic conditions or replace the column.
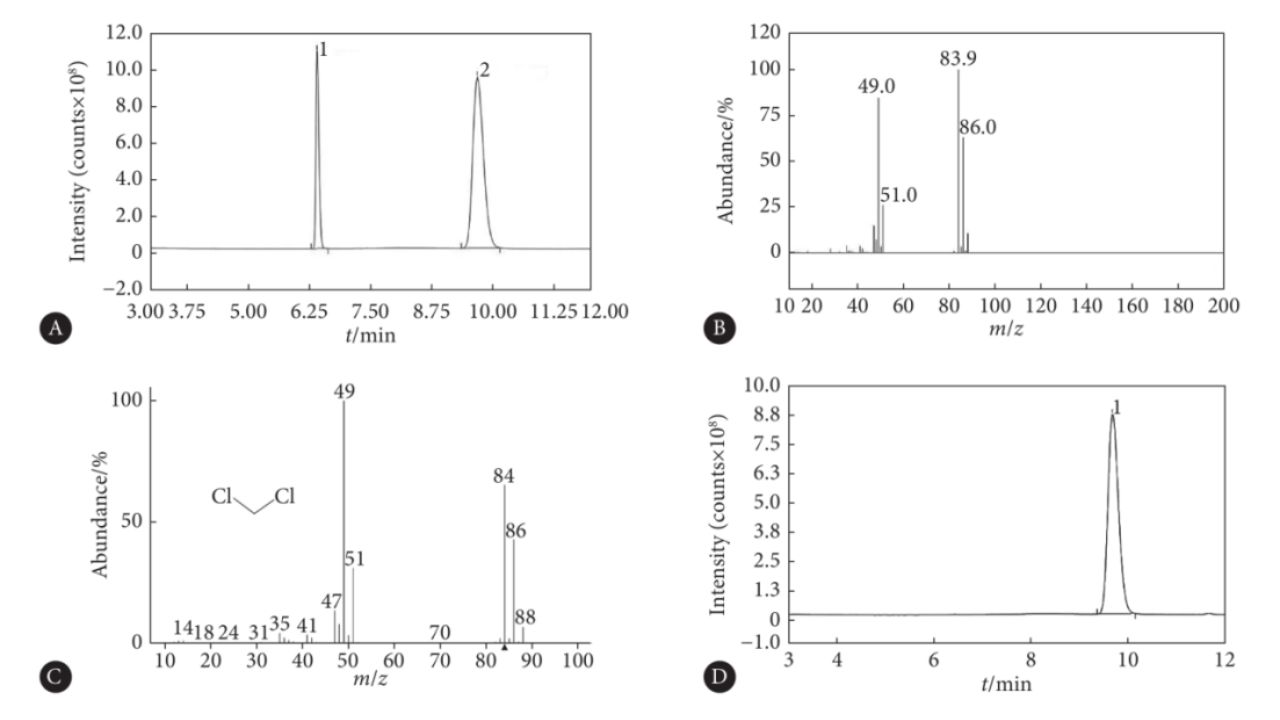
Detection example of dichloromethane in blood by headspace gas chromatography and GC-MS
11. How does gas chromatography-mass spectrometry work?
A mass spectrometric detector (MSD, GC-MS) is used to ionize the analyte using electromagnetic principles and separate, detect, and record the generated ions according to their mass-to-charge ratio (m/z). Qualitative, quantitative, and structural analyses are then performed based on the obtained mass spectrum.
In gas chromatography detection, sometimes two compounds cannot be separated. Relying solely on ambiguous peak times may lead to incorrect qualitative results and make accurate integration and quantification difficult. What can be done? Coupling with mass spectrometry is a good option. Gas chromatography-mass spectrometry, also known as GC-MS, is a technique where gas chromatography-mass spectrometry is used.
Mass spectrometry (MS) can be understood as a specialized detector in gas chromatography. MS converts the physical or chemical properties of a compound into an electrical signal related to those properties. Continuously recorded electrical signals form a two-dimensional graph of time and electrical signal, similar to an electrocardiogram (ECG). At each time point, MS records not just a simple electrical signal, but a mass spectrum containing structural information. By comparing these mass spectra, more accurate qualitative analysis can be achieved. Observing characteristic mass spectral fragments of the compound allows for better elimination of interference and accurate quantification.
Using MS as a detector combines the advantages of gas chromatography in separating mixtures with the excellent qualitative and quantitative properties of MS, allowing for separation before analysis. It is suitable for the qualitative and quantitative analysis of low-boiling-point mixtures. For integration with MS, the carrier gas is typically He. MS acts like an X-ray vision system, distinguishing signals from different compounds by different properties, effectively solving the problem of indistinguishable compounds.
However, there are special cases, such as when two co-eluting compounds are isomers, like resorcinol and catechol, in which case MS cannot distinguish them.
12. GC-MS vs LC-MS vs GD-MS vs ICP-MS
Gas Chromatography-Mass Spectrometry, Liquid Chromatography-Mass Spectrometry, Glow Discharge Mass Spectrometry, and Inductively Coupled Plasma Mass Spectrometry are all common chromatographic instruments. Theoretically, they can detect most samples, but in practical applications, they differ in their strengths for detecting certain substances.
Gas Chromatography-Mass Spectrometry (GC-MS): Detects gases, solvents, or volatile components in solutions, small monomers, and small additives. It can be used for the identification, qualitative, and semi-quantitative analysis of organic molecules, providing information about organic molecules.
Liquid Chromatography-Mass Spectrometry (LC-MS): Complementary to GC-MS, it detects non-volatile components in solutions, allowing for targeted analysis of a specific component. It is particularly commonly used for drug molecules, surfactants, and can be used for qualitative, semi-quantitative, or quantitative analysis. Information about organic molecules is obtained.
Glow Discharge Mass Spectrometry (GD-MS): This is also an elemental analysis instrument, generally used to measure impurities, composition, and low-abundance components in solid materials. It can also perform thick film analysis, i.e., depth profiling at the particle scale, showing differences in components from the surface to depth. It is commonly used in the detection and analysis of film structures in solar photovoltaics, with detection limits reaching the ppt and ppb levels.
Inductively Coupled Plasma Mass Spectrometry (ICP-MS): Primarily obtains elemental composition, with detection limits reaching the ppt and ppb levels for the elements it can detect.